Data and Visualization
library(dplyr)
starwars
## # A tibble: 87 x 14
## name height mass hair_color skin_color eye_color birth_year sex gender
## <chr> <int> <dbl> <chr> <chr> <chr> <dbl> <chr> <chr>
## 1 Luke S~ 172 77 blond fair blue 19 male mascu~
## 2 C-3PO 167 75 <NA> gold yellow 112 none mascu~
## 3 R2-D2 96 32 <NA> white, bl~ red 33 none mascu~
## 4 Darth ~ 202 136 none white yellow 41.9 male mascu~
## 5 Leia O~ 150 49 brown light brown 19 fema~ femin~
## 6 Owen L~ 178 120 brown, grey light blue 52 male mascu~
## 7 Beru W~ 165 75 brown light blue 47 fema~ femin~
## 8 R5-D4 97 32 <NA> white, red red NA none mascu~
## 9 Biggs ~ 183 84 black light brown 24 male mascu~
## 10 Obi-Wa~ 182 77 auburn, wh~ fair blue-gray 57 male mascu~
## # ... with 77 more rows, and 5 more variables: homeworld <chr>, species <chr>,
## # films <list>, vehicles <list>, starships <list>Mass Vs Weight
We will study the mass vs weight relationship through a scatterplot
library(ggplot2)
ggplot(starwars, aes(x = height, y = mass)) + geom_point() + labs(title = "Mass vs. height of Starwars characters",
       x = "Height (cm)", y = "Weight (kg)")
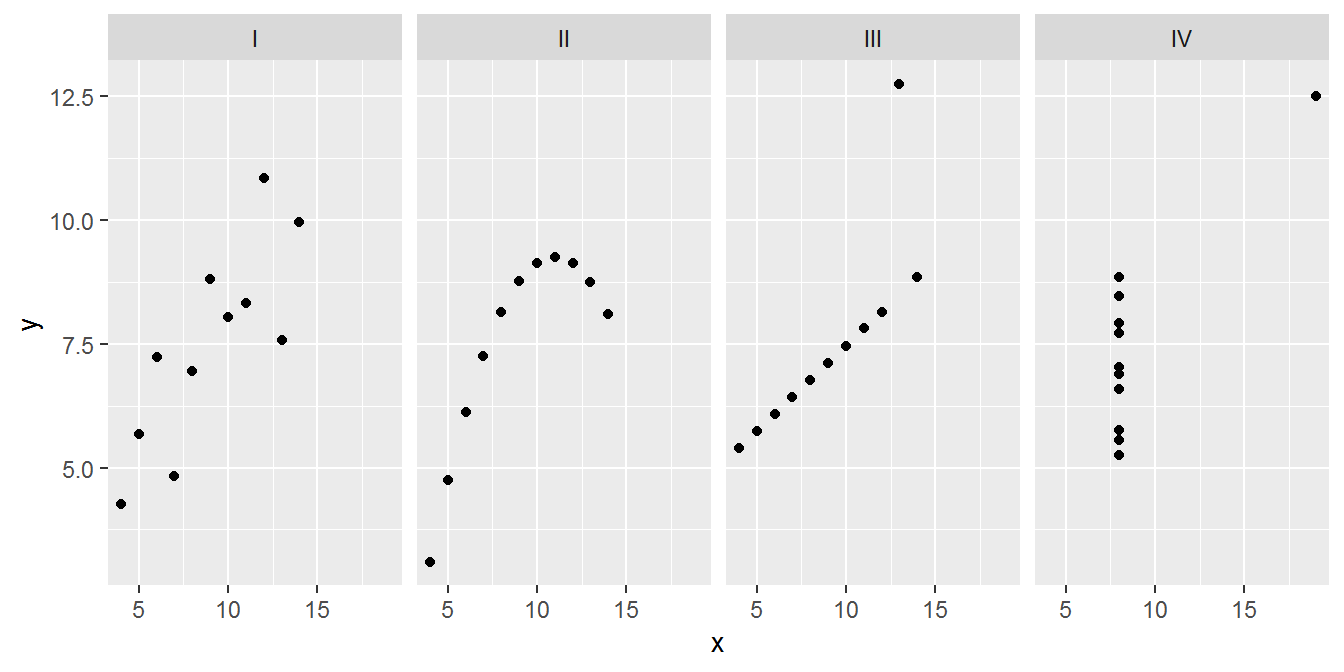
Anscombe’s Quartet
We summarize the quartet information by each set of data
library(Tmisc)
quartet %>%
  group_by(set) %>%
  summarise(
    mean_x = mean(x),
    mean_y = mean(y),
    sd_x = sd(x),
    sd_y = sd(y),
    r = cor(x, y)
  )
## # A tibble: 4 x 6
## set mean_x mean_y sd_x sd_y r
## <fct> <dbl> <dbl> <dbl> <dbl> <dbl>
## 1 I 9 7.50 3.32 2.03 0.816
## 2 II 9 7.50 3.32 2.03 0.816
## 3 III 9 7.5 3.32 2.03 0.816
## 4 IV 9 7.50 3.32 2.03 0.817we visualize all four sets
