North Carolina births, 100 cases Data Visualization
1. Single comparison
1.1. baby sex
## # A tibble: 150 x 9
## f_age m_age weeks premature visits gained weight sex_baby smoke
## <int> <int> <int> <fct> <int> <int> <dbl> <fct> <fct>
## 1 31 30 39 full term 13 1 6.88 male smoker
## 2 34 36 39 full term 5 35 7.69 male nonsmoker
## 3 36 35 40 full term 12 29 8.88 male nonsmoker
## 4 41 40 40 full term 13 30 9 female nonsmoker
## 5 42 37 40 full term NA 10 7.94 male nonsmoker
## 6 37 28 40 full term 12 35 8.25 male smoker
## 7 35 35 28 premie 6 29 1.63 female nonsmoker
## 8 28 21 35 premie 9 15 5.5 female smoker
## 9 22 20 32 premie 5 40 2.69 male smoker
## 10 36 25 40 full term 13 34 8.75 female nonsmoker
## # ... with 140 more rows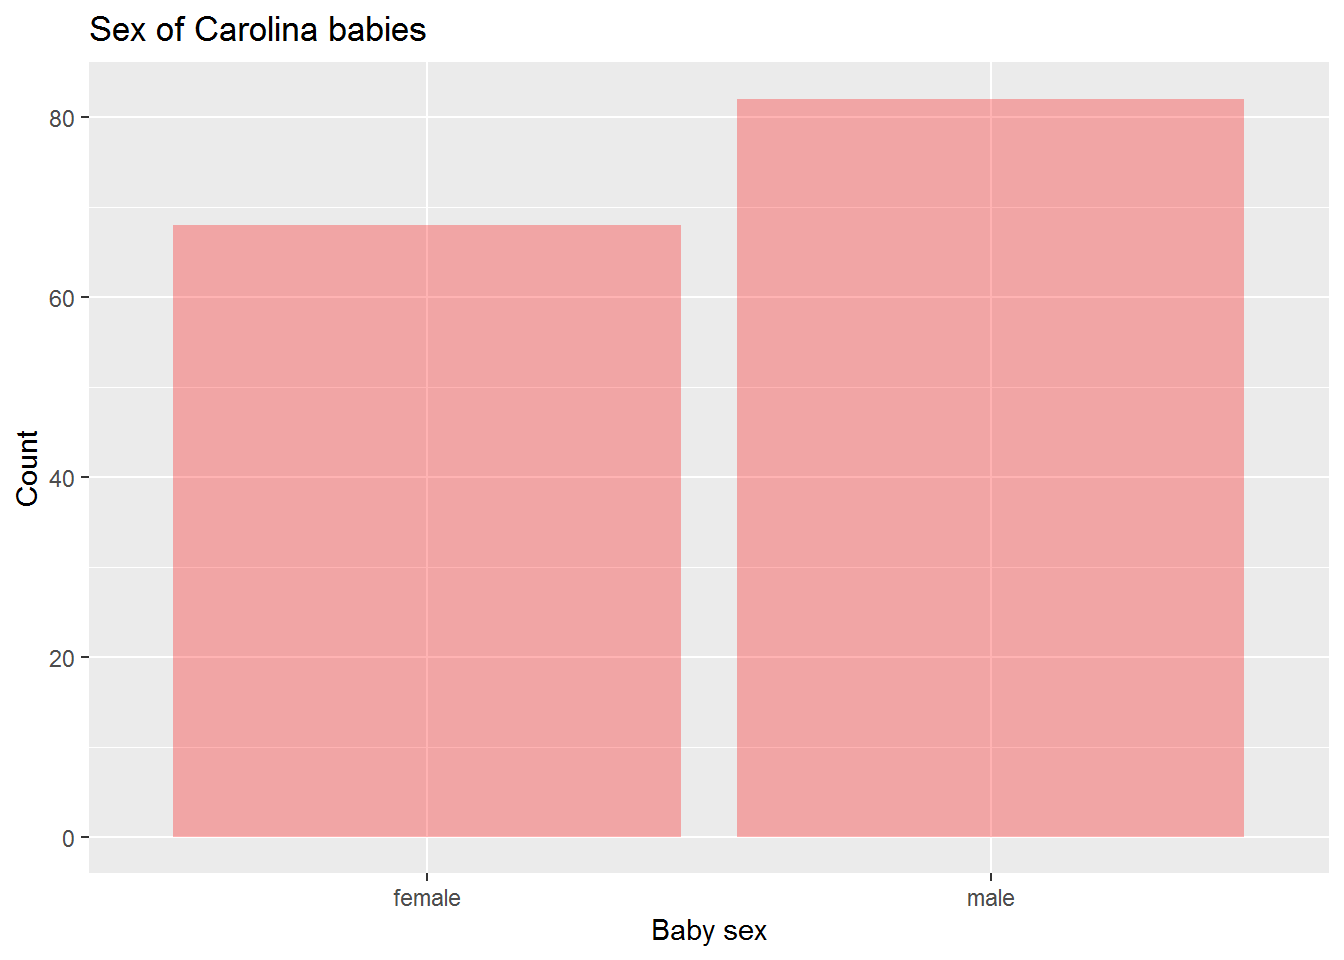 1.2. Mother age
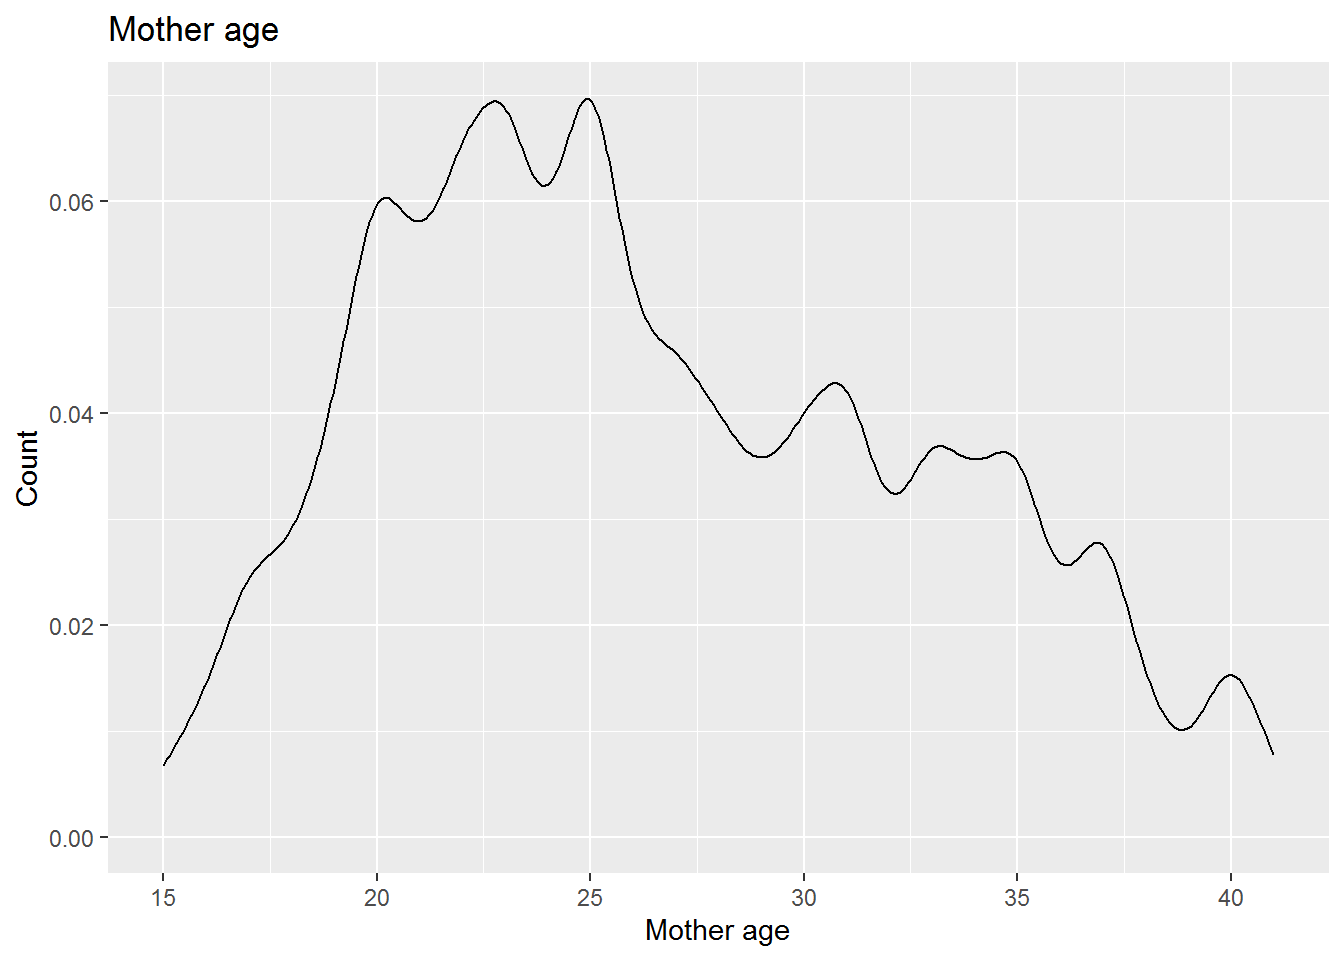
2. Multi-lateral comparison
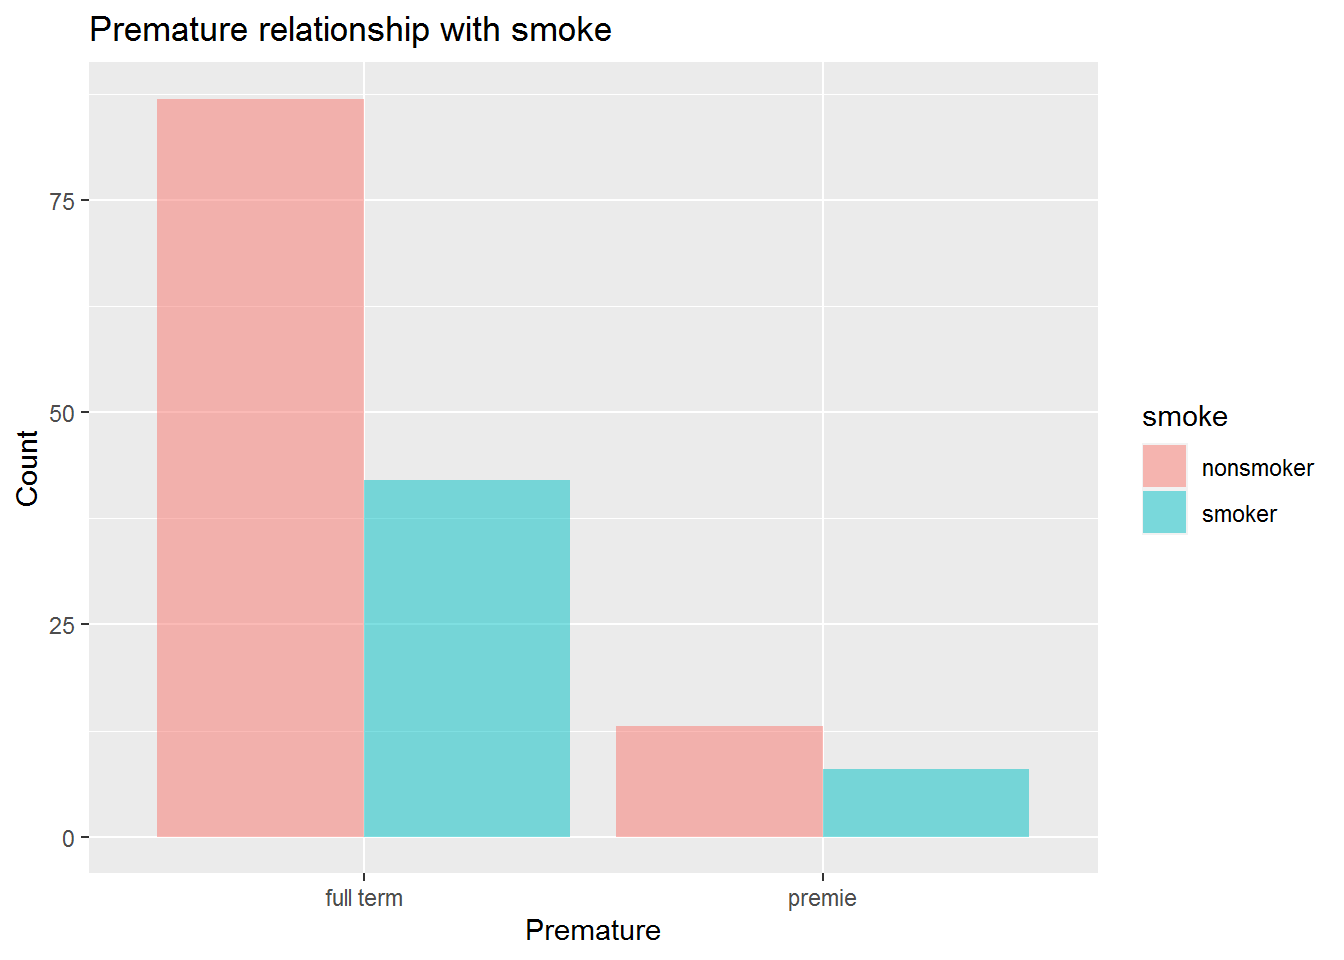
2.1. Premature-smoke
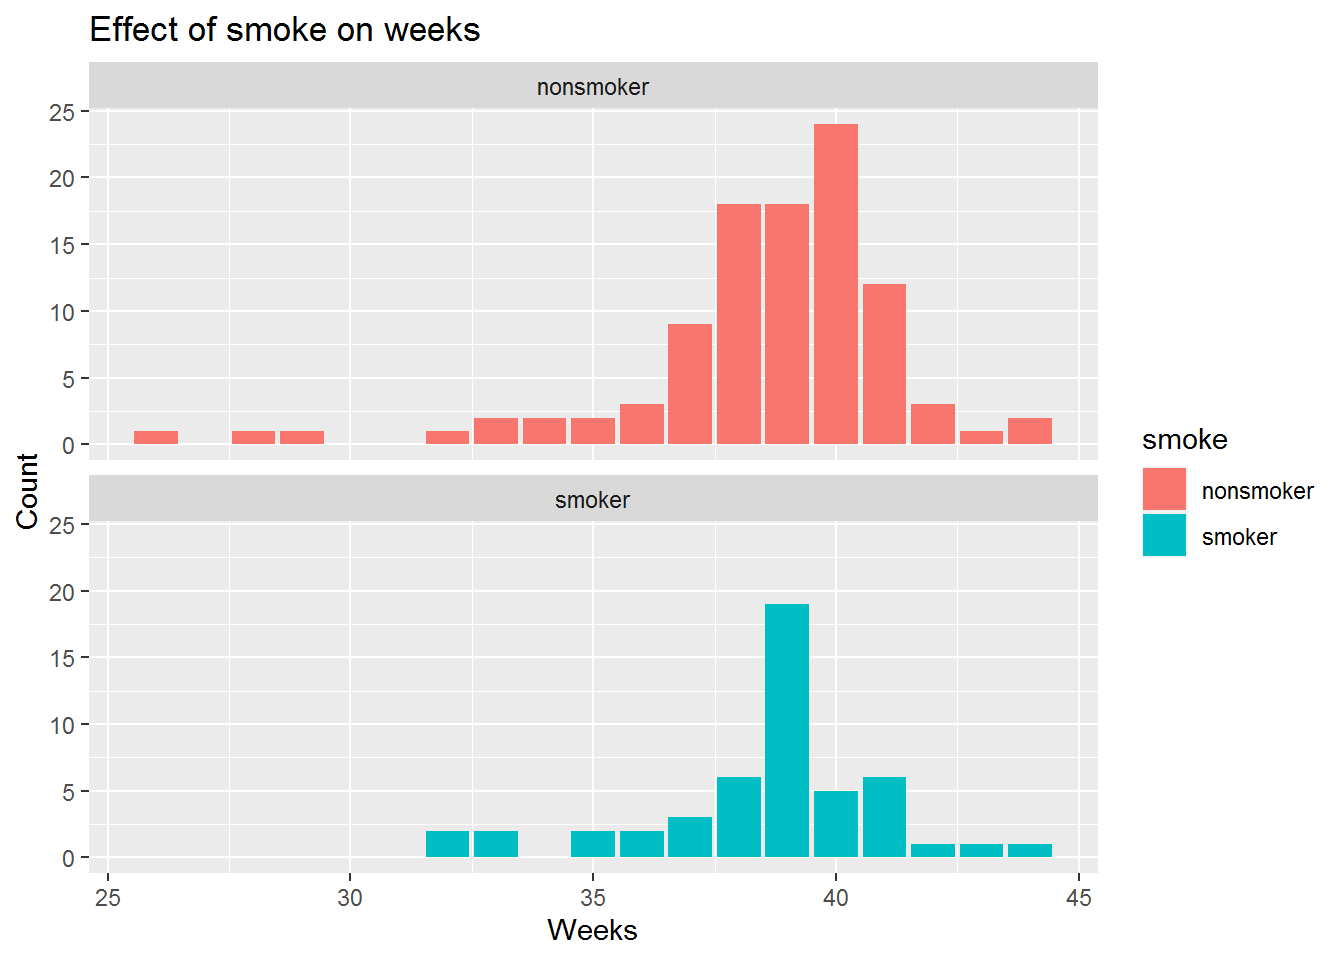
 2.2. Weeks-smoke
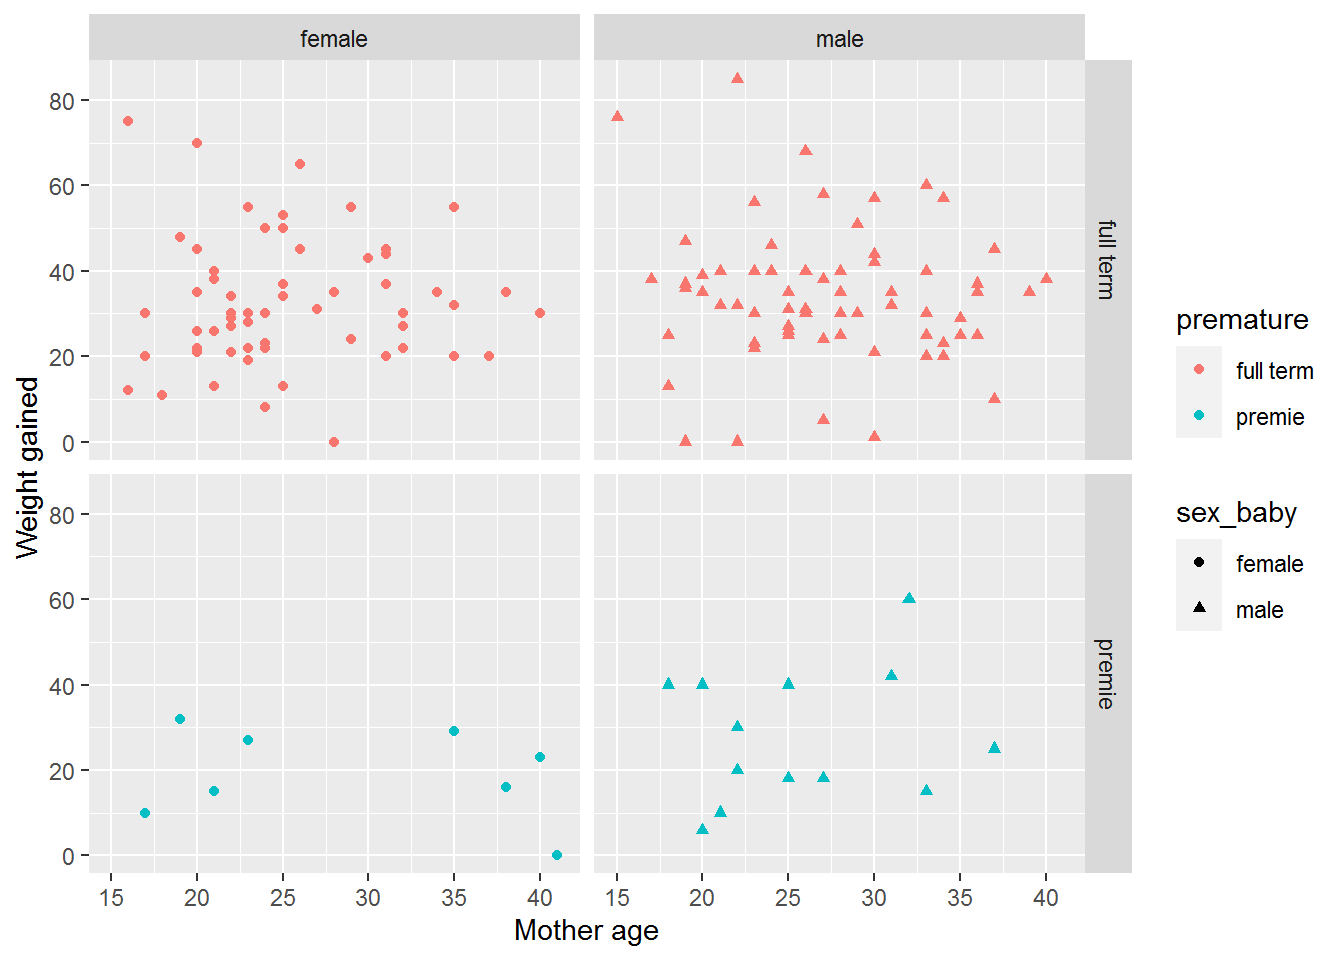
2.3. Mother age-gained-Premature-sex_baby
 2.4. Weight-sex_baby
 According to the comparisons, the number male baby births is more than those of female.Number of nonsmoker mothers for premie is more than smoker but we should notice that more percentage of smoker mothers leads to premie compared with nonsmoker mothers. In other words, the probability of premature in case of smoker mother is more than nonsmoker one. Moreover, number of premie in male babies and mothers between 20-25 age is the most.