Import lego_sales.csv file
library(tidyverse)## -- Attaching packages --------------------------------------- tidyverse 1.3.1 --## v ggplot2 3.3.3 v purrr 0.3.4
## v tibble 3.1.1 v dplyr 1.0.6
## v tidyr 1.1.3 v stringr 1.4.0
## v readr 1.4.0 v forcats 0.5.1## -- Conflicts ------------------------------------------ tidyverse_conflicts() --
## x dplyr::filter() masks stats::filter()
## x dplyr::lag() masks stats::lag()lego <- read_csv(file = "lego_sales.csv")##
## -- Column specification --------------------------------------------------------
## cols(
## first_name = col_character(),
## last_name = col_character(),
## age = col_double(),
## phone_number = col_character(),
## set_id = col_double(),
## number = col_character(),
## theme = col_character(),
## subtheme = col_character(),
## year = col_double(),
## name = col_character(),
## pieces = col_double(),
## us_price = col_double(),
## image_url = col_character(),
## quantity = col_double()
## )lego <- read_csv(file.choose())##
## -- Column specification --------------------------------------------------------
## cols(
## first_name = col_character(),
## last_name = col_character(),
## age = col_double(),
## phone_number = col_character(),
## set_id = col_double(),
## number = col_character(),
## theme = col_character(),
## subtheme = col_character(),
## year = col_double(),
## name = col_character(),
## pieces = col_double(),
## us_price = col_double(),
## image_url = col_character(),
## quantity = col_double()
## )head(lego)## # A tibble: 6 x 14
## first_name last_name age phone_number set_id number theme subtheme year
## <chr> <chr> <dbl> <chr> <dbl> <chr> <chr> <chr> <dbl>
## 1 Kimberly Beckstead 24 216-555-2549 24701 76062 DC Comi~ Mighty M~ 2018
## 2 Neel Garvin 35 819-555-3189 25626 70595 Ninjago Rise of ~ 2018
## 3 Neel Garvin 35 819-555-3189 24665 21031 Archite~ <NA> 2018
## 4 Chelsea Bouchard 41 <NA> 24695 31048 Creator <NA> 2018
## 5 Chelsea Bouchard 41 <NA> 25626 70595 Ninjago Rise of ~ 2018
## 6 Chelsea Bouchard 41 <NA> 24721 10831 Duplo <NA> 2018
## # ... with 5 more variables: name <chr>, pieces <dbl>, us_price <dbl>,
## # image_url <chr>, quantity <dbl>What are the three most common first names of customers?
lego %>%
  count(first_name, sort = TRUE)
## # A tibble: 211 x 2
## first_name n
## <chr> <int>
## 1 Jackson 13
## 2 Jacob 11
## 3 Joseph 11
## 4 Michael 10
## 5 Audrey 8
## 6 Connor 8
## 7 Kaitlyn 8
## 8 Lucas 8
## 9 Amanda 7
## 10 Joshua 7
## # ... with 201 more rowsJackson, Jacob, and Joseph are the three most common first names.
What are the three most common themes of lego sets purchased?
lego %>%
  count(theme, sort = TRUE)
## # A tibble: 25 x 2
## theme n
## <chr> <int>
## 1 Star Wars 75
## 2 Nexo Knights 64
## 3 Gear 55
## 4 Mixels 55
## 5 City 45
## 6 Friends 42
## 7 Ninjago 38
## 8 Duplo 35
## 9 Bionicle 34
## 10 Creator 25
## # ... with 15 more rowsStar Wars, Nexo Knights, and Gear are the three most common themes.
Among the most common theme of lego sets purchased, what is the most common subtheme?
lego %>%
  filter(theme == "Star Wars" | theme == "Nexo Knights" | theme == "Gear") %>%
  count(subtheme, sort = TRUE)
## # A tibble: 27 x 2
## subtheme n
## <chr> <int>
## 1 <NA> 42
## 2 Ultimate 22
## 3 The Force Awakens 15
## 4 Buildable Figures 11
## 5 Episode V 10
## 6 MicroFighters 10
## 7 Battlefront 7
## 8 Original Content 7
## 9 Role-Play toys 7
## 10 Stationery 7
## # ... with 17 more rowsUltimate is the most common subtheme among the most common theme of lego sets.
Create a new variable called age_group and group the ages into the following categories: “18 and under”, “19 - 25”, “26 - 35”, “36 - 50”, “51 and over”. Be sure to save the updated data set so you can use the new variable in other questions.
lego_age <- lego %>%
  mutate(age_group = case_when(between(age, 1, 18) ~ "18 and under", between(age, 19, 25) ~ "19 - 25", between(age, 26, 35) ~ "26 - 35", between(age, 36, 50) ~ "36 - 50", between(age, 51, 68) ~ "51 and over"))
age <- lego_age %>%
  select(first_name, last_name, age_group)
age
## # A tibble: 620 x 3
## first_name last_name age_group
## <chr> <chr> <chr>
## 1 Kimberly Beckstead 19 - 25
## 2 Neel Garvin 26 - 35
## 3 Neel Garvin 26 - 35
## 4 Chelsea Bouchard 36 - 50
## 5 Chelsea Bouchard 36 - 50
## 6 Chelsea Bouchard 36 - 50
## 7 Bryanna Welsh 19 - 25
## 8 Bryanna Welsh 19 - 25
## 9 Caleb Garcia-Wideman 36 - 50
## 10 Caleb Garcia-Wideman 36 - 50
## # ... with 610 more rowsWhat is the probability a randomly selected customer
is in the 19 - 25 age group?
lego_age %>%
count(age_group == "19 - 25")/nrow(lego_age)
## age_group == "19 - 25" n
## 1 0.000000000 0.7919355
## 2 0.001612903 0.2080645Answer: 0.208
is in the 19 - 25 age group and purchased a Duplo theme set?
lego_age %>%
count(age_group == "19 - 25" & theme == "Duplo")/nrow(lego_age)
## age_group == "19 - 25" & theme == "Duplo" n
## 1 0.000000000 0.98548387
## 2 0.001612903 0.01451613Answer: 0.0145
is in the 19 - 25 age group given they purchased a Duplo theme set?
lego_age_d <- lego_age %>%
  filter(theme == "Duplo")
lego_age %>%
filter(theme == "Duplo") %>%
count(age_group == "19 - 25")/nrow(lego_age_d)## age_group == "19 - 25" n
## 1 0.00000000 0.7428571
## 2 0.02857143 0.2571429Answer: 0.257
Which age group has purchased the largest number of lego sets? How many did they purchase?
lego_age_q <- lego_age %>%
  group_by(age_group) %>%
 summarize(s = sum(quantity))

lego_age_q
## # A tibble: 5 x 2
## age_group s
## <chr> <dbl>
## 1 18 and under 45
## 2 19 - 25 174
## 3 26 - 35 267
## 4 36 - 50 313
## 5 51 and over 92Age group “36 - 50” has purchased the largest number of lego sets which is 313.
Which age group has spent the most money on legos? How much did they spend?
lego_age_spend <- lego_age %>%
  mutate(spend = us_price * quantity) %>%
  arrange(desc(spend))
lego_age_spend
## # A tibble: 620 x 16
## first_name last_name age phone_number set_id number theme subtheme year
## <chr> <chr> <dbl> <chr> <dbl> <chr> <chr> <chr> <dbl>
## 1 Jennifer Dana 26 956-555-9719 25597 75827 Ghost~ <NA> 2018
## 2 Cecilia Mauro 50 <NA> 25921 75157 Star ~ Rebels 2018
## 3 Kaitlyn Degeer 24 316-555-7890 24994 10251 Advan~ Modular ~ 2018
## 4 Elias Garrett 50 832-555-9165 24915 60130 City Police 2018
## 5 Hector Collins 20 340-555-2508 24627 75098 Star ~ Ultimate~ 2018
## 6 Nerea Feldman 28 423-555-9631 25921 75157 Star ~ Rebels 2018
## 7 Carolyn Quarry 23 567-555-7649 25627 70596 Ninja~ Rise of ~ 2018
## 8 Cody Gonzales 44 973-555-3236 25922 75149 Star ~ The Forc~ 2018
## 9 Caleb Garcia-Wi~ 37 907-555-9236 25611 21127 Minec~ Minifig-~ 2018
## 10 Melanie Rollert 43 <NA> 26026 41179 Elves <NA> 2018
## # ... with 610 more rows, and 7 more variables: name <chr>, pieces <dbl>,
## # us_price <dbl>, image_url <chr>, quantity <dbl>, age_group <chr>,
## # spend <dbl>26 - 35 age group has spent the most money on legos, $699.98.
Come up with a question you want to answer using this data, and write it down. Then, create a data visualization that answers the question, and briefly explain how your visualization answers the question.
Which age group has spend the most on Star Wars theme?
lego_age_s <- lego_age_spend %>%
filter(theme == "Star Wars")
ggplot(lego_age_s, aes(age_group, spend)) +
geom_col(fill = "red")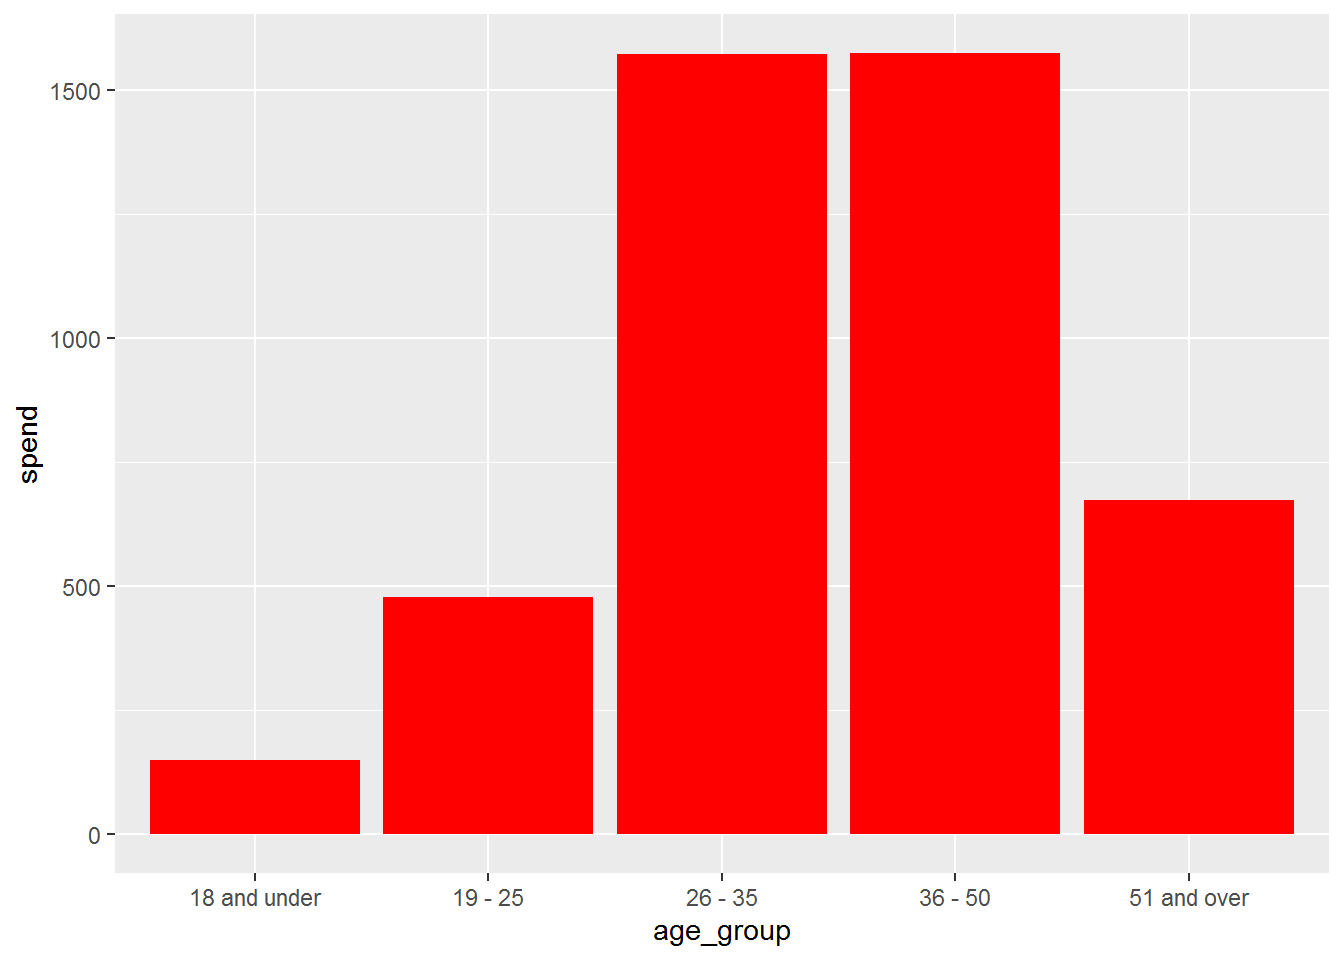 Age group 26-35 has purchased the most pieces of lego sets, almost 8000 pieces of star wars theme.
Add one element to the plot from the previous exercise to change the look of the plot without changing the underlying data. For example, you can change the theme, background color, add annotations, etc. State the change you’re making and display the updated visualization. We encourage you to be creative!
lego_age_s <- lego_age_spend %>%
filter(theme == "Star Wars")
ggplot(lego_age_s, aes(age_group, spend)) +
geom_col(alpha = 0.8, fill = "lightgreen") +
theme_minimal() +
labs(
x = "Age group", y = "Spend",
title = "Total puchase amount of starwars theme purchased by each age group"
)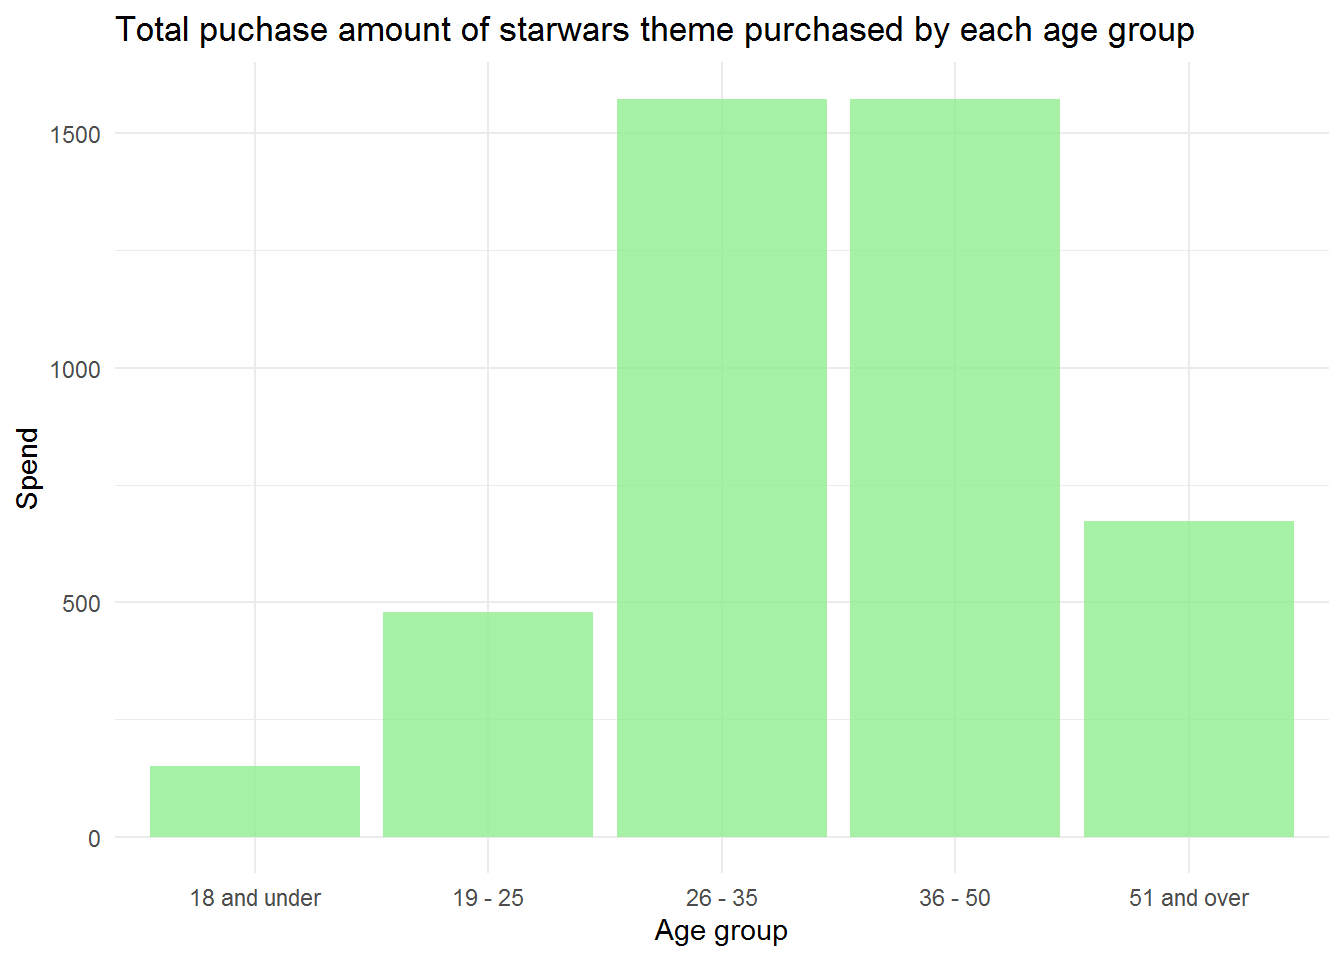 I added minimal theme and labels for title, x axis, and y axis.