Import agriculture-and-rural-development.csv file
Please fin the data file href = “https://github.com/ZeningQu/World-Bank-Data-by-Indicators”
Data explanation: Sustainability deveopment in Canada’s agriculture sector
Sustainability development has attracted much attention in recent years. To implement sustainability, supply chain players should meet environmental and social concerns and also minimize costs. In this data exploratory, we want to investigate the sustainability pillars in agricultural sector in Canada.
Questions
- What are the environmental factors in the data set?
- Do the environmental pillar contribute to the sustainability?
- What is the role of fertilizer in environmental sustainability in Canada’s agriculture?
- What is the effect of arable land area on sustainability?
- What is the nitrous oxide emissions amount in rcent years and it’s relationship with fertilizer?
- What is the impact of methane emissions percent of total on sutainable development?
- How yearly employment in agriculture percent of total employment could affect social pillar?
- Does yearly agricultural machinery tractors per 100_sq_km_of arable land affect employment?
- Is there any relationship between rural population growth and employment rate?
- How agriculture_forestry_and_fishing_value_added_percent_of_gdp contributes to the economic pilar?
- How early agricultural raw materials exports percent of merchandise exports contributes to the economic pilar?
- How early agricultural raw materials imports percent of merchandise imports contributes to the economic pilar?
Environmental pillar
In this part, environmental aspect of sustainability is explored by plotting arable land percentage, fertilizer consumption, agricultural methane emissions percent, and agricultural nitrous oxide emissions. These are the most related environmental pillars in this data set that highly affects the sustainability development in agriculture sector. In the following, the analysis of each plot is provided.
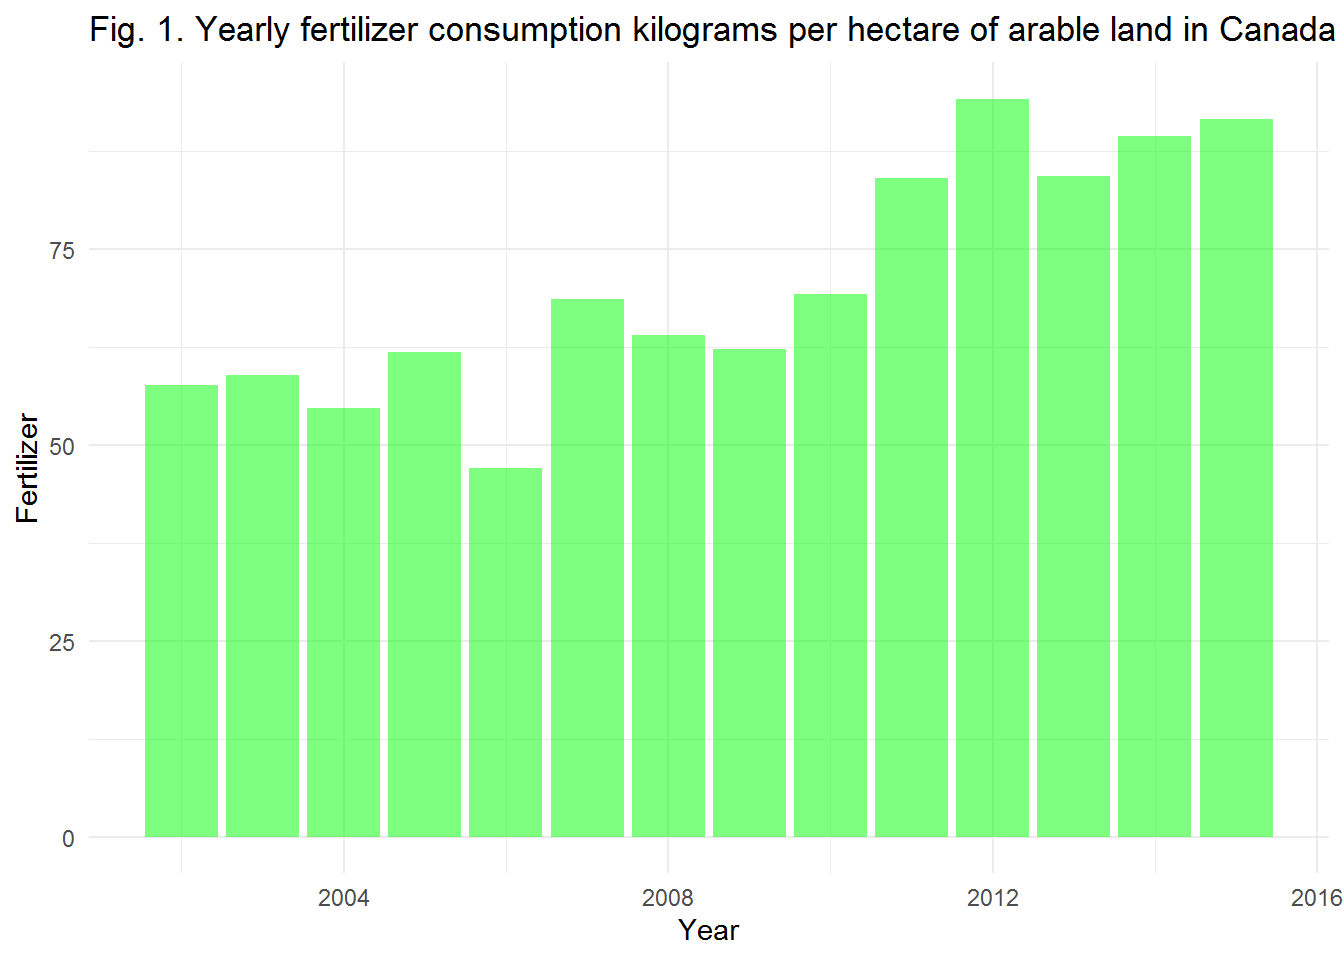 First of all, only have the data for 2002-2015. Sustainability concept is produced in 1987 for the first time. Therefore, it was better to compare the last decade to the previous ones to find the growth of indicators. As shown in Fig. 1, during the last decade, fertilizer consumption hes been increasing. This is not in line with the sustainability development goals. However, it’s possible that this enhancement is the cause of more agri-food production in arable lands to meet the need of growing population. Therefore, we should investigate arable land percent of land area.
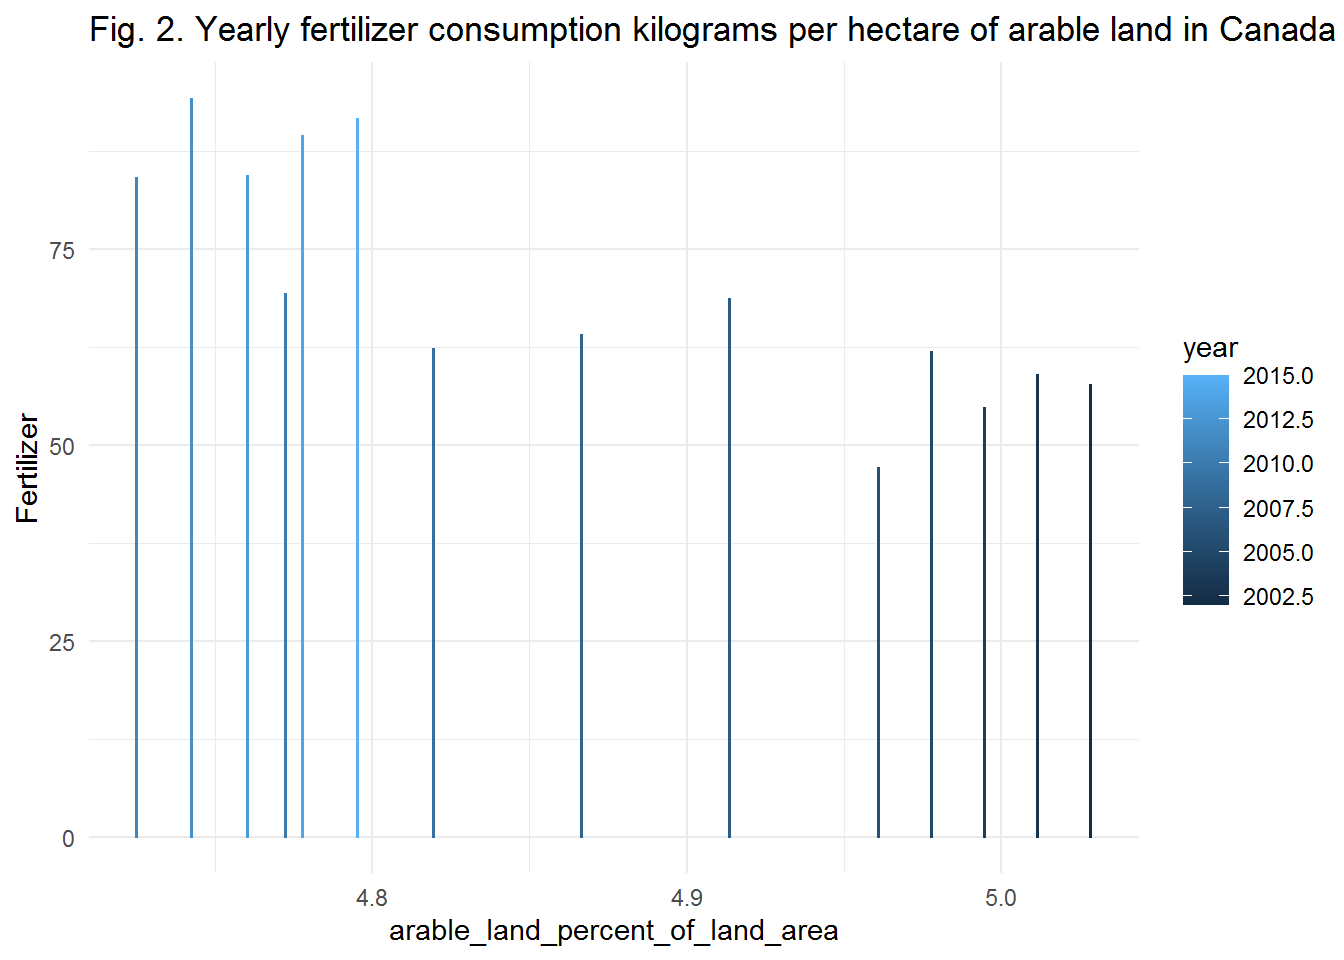 As indicated in Fig. 2, in the most recent years of available date, arable_land_percent_of_land_area is decreasing while fertilizer utilization is increasing. This means that agri-businesses are using more fertilizer in a less arable area in recent years. Agriculural supply chains should find a better solution for producing more food rather than enhancing the utilization of fertilizers. Accordingly, there is a need to investigate the agricultural nitrous oxide emissions which is the result of fertilizer use in agriculture sector.
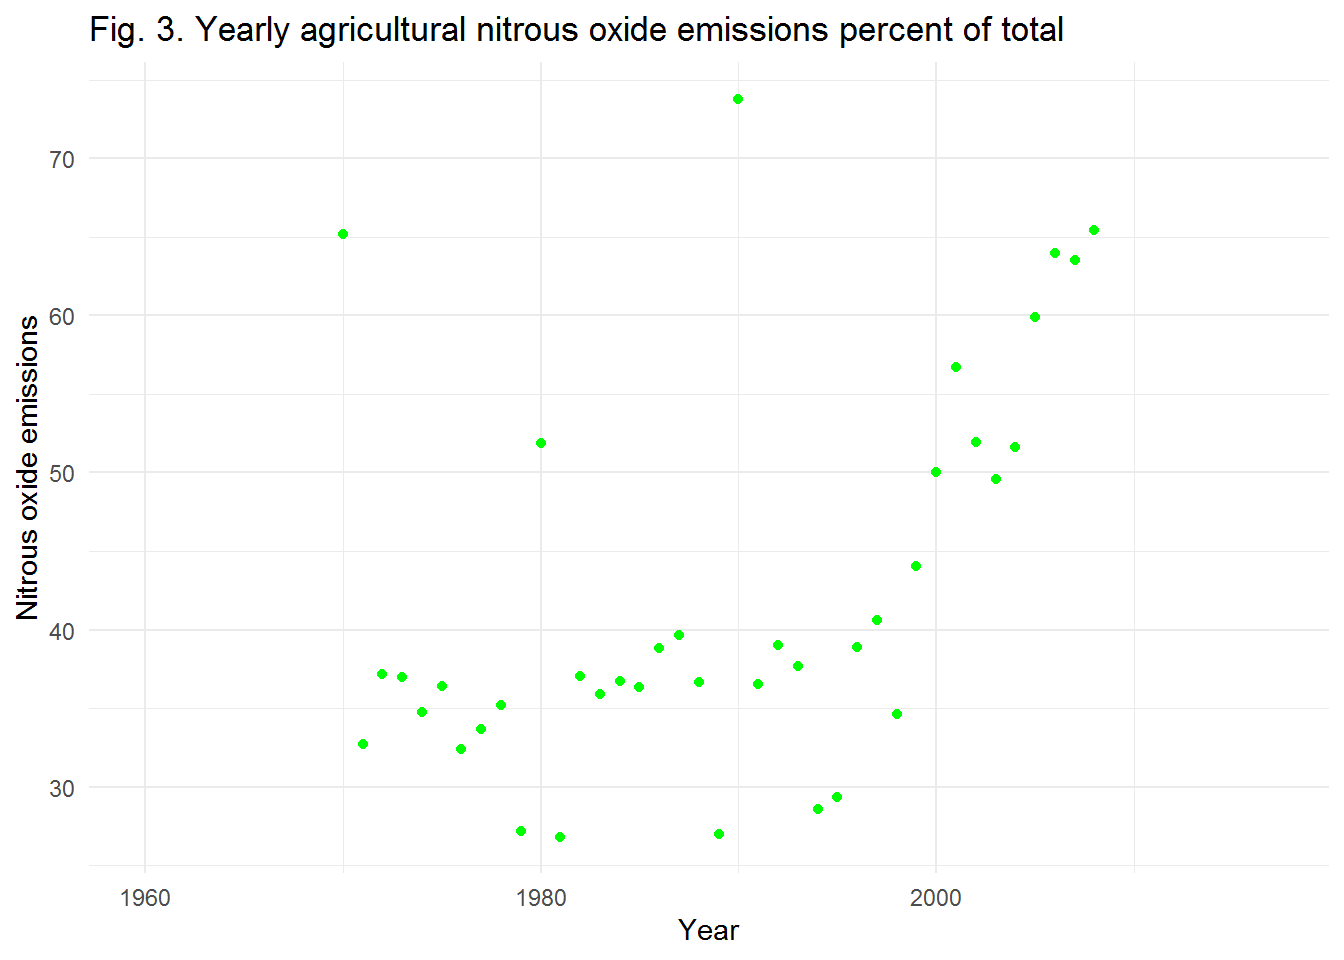 First about data, nitrous oxide emissions date is more based on the 1970-2010. we can see three outlier data relating to 1970, 1980, and 1990. But we can see the increasing trend in nitrous oxide emissions. This increase is the result of fertilizer consumption. Therefore, now we are sure that the agricultural actors should find a solution for this emission and its effects on the climate change and sustainability.
 First of all, metane emissions date is more based on the 1970-2010. It was better to have more updated data. We can also find three outliers data relating to 1970, 1980, and 1990. The food system is one of the largest emitters of methane. Therefore, methane emission investigation is of high importance. In recent years of date set, 2000-2010, the methane emission trend is almost increasing. However, from 1975 to 1995, we see the decreaing trend. Therefore, it has not a steady trend but the last decade is more important to our analysis that shows the enhancing trend. All in all, agricultural supply chain players should pay more attention to environmental pillar of sustainability.
Economic pillar
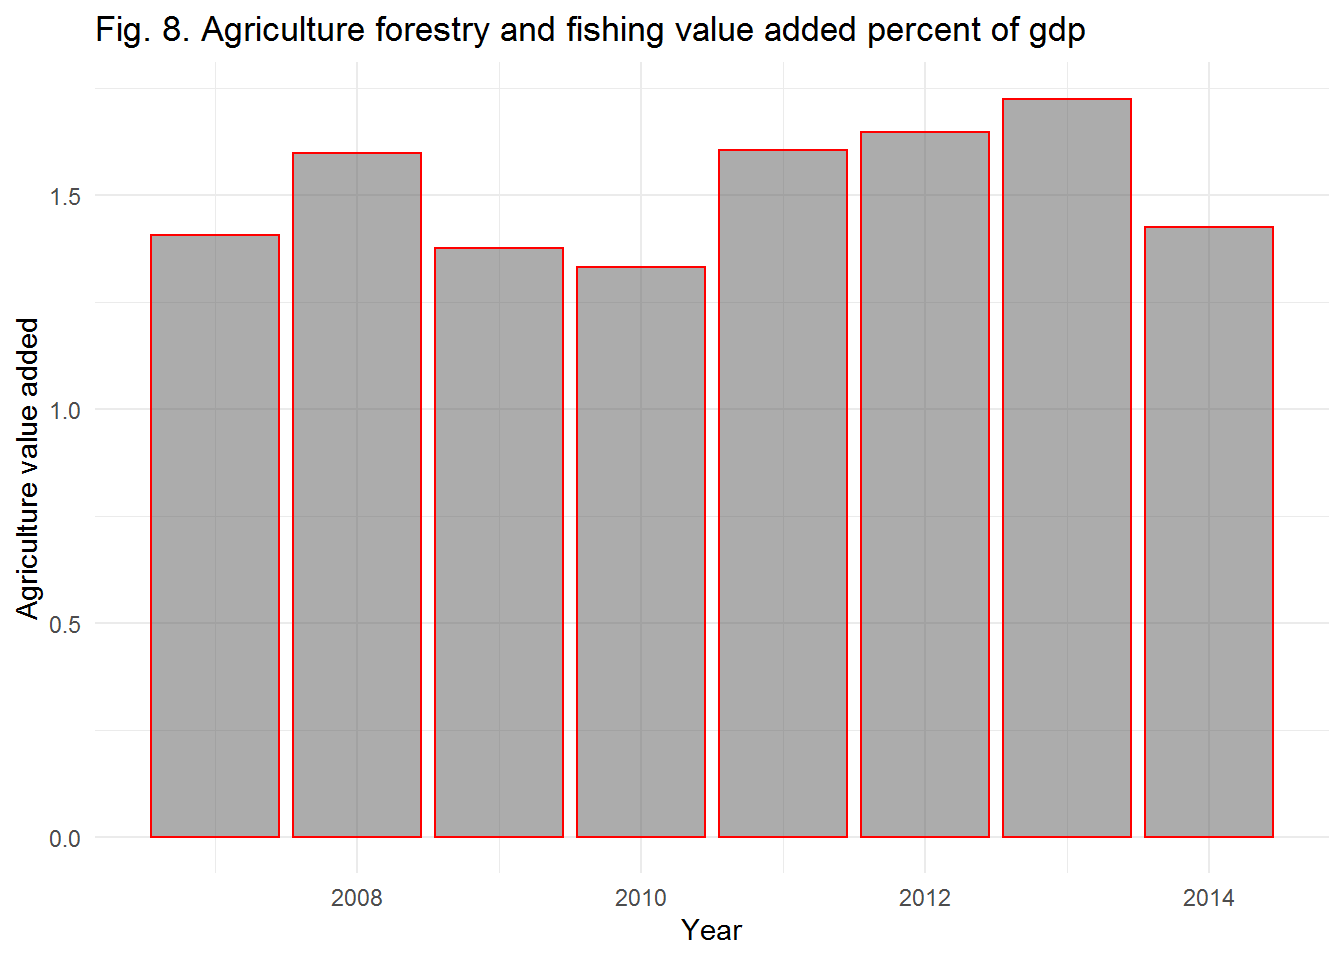 Increasing the profitability of agriculture supply chains or decreasing the costs of chains is the goal of economical aspect of sustainability development.However, we do not have straight-forward data that directly investigate the profit or cost.Fig. 8 plots the agriculture forestry and fishing value added percent of gdp in Canada. As shown, we only have the data of 2007 to 2014. Moreover, there is no significant increasing or decreasing trend in that.
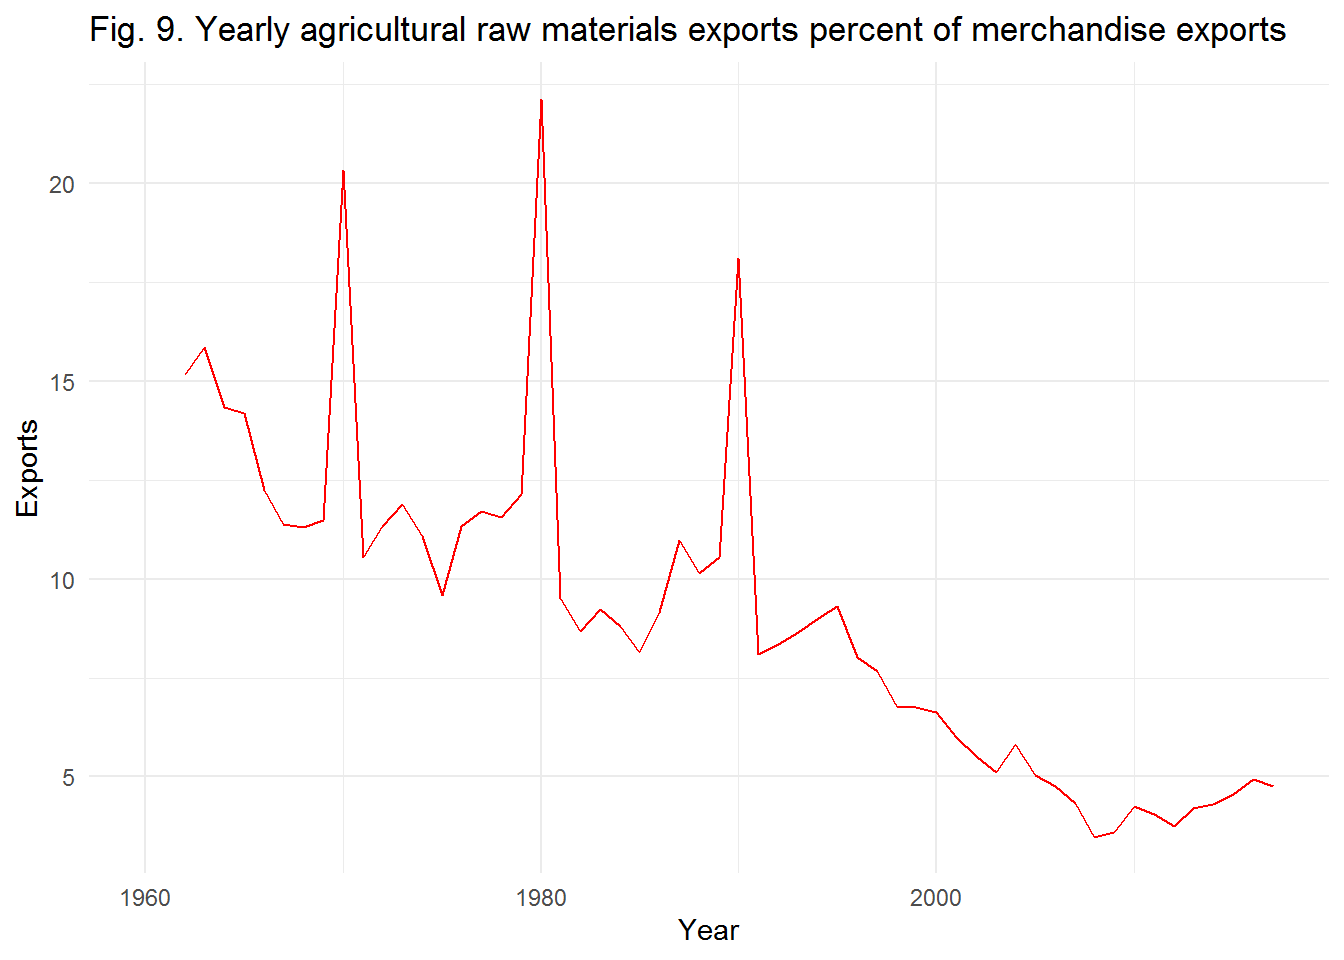
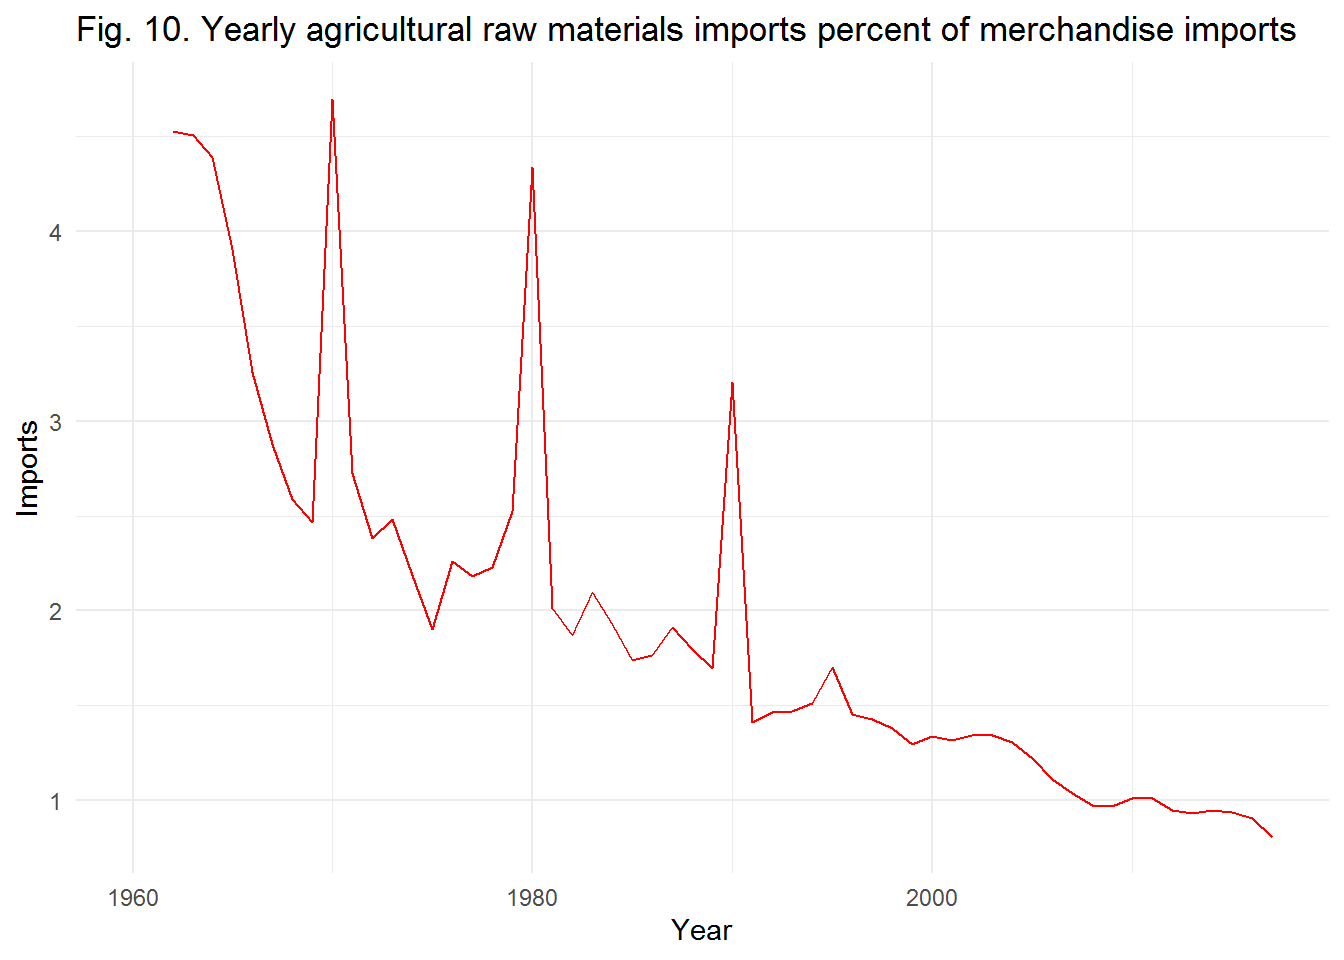 Other related data to the economical aspect of sustainability in the data set are export and import percentage of total merchandise in Canada. Figs. 9 and 10 show that there is a decreasing trend in agricultural raw materials export and import. In both figures, we can see the outlier data in 1970, 1980, and 1990. Fig. 9 show that exports amount is more than import amount by comparing import and export amounts year by year. Therefore, we conclude that agriculture in Canada is economically profitable that supports the economic pilar of sustainability.
Summary
The data set provides the information of agriculture sector and we aimed to investigate the sustainability development factors in the Canada for the available years. Some part of data lacks sufficient data especially for the early years of study. Other have outlier data for some of years. All in all, we conclude that agricultural sector in Canada should pay more attention to the environmental and social aspect of sustainability. The economic pilar works well and it seems to be profitable.
Social pillar
In this section, the social indicators of sustainability addressed in the data set of agriculture are explored.
In the dataset, we have the agricultural machinery tractors information from 1960-2011. Note that the amount for 1970, 1980, and 1990 are not reliable. According to Fig. 6, the increase in agricultural machinery tractors during 1990-2011 is not enough significant to supports the lower rate of employment in agriculture sector in Canada. Therefore, we could explore other social indicators according to the available data.